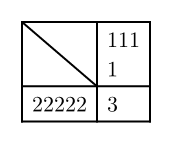
如何绘制带斜线(对角线)的表格?
理想情况下,斜线单元格的尺寸需要随其它单元格变化,目前没有内置支持;不过有几种纸糊的方法。
利用 metadata 测量单元格尺寸
typst
#table(
  columns: 2,
  table.cell(inset: 0pt, {
    place(top + left, metadata("__th"))
    place(bottom + right, metadata("__th"))
    context {
      let (p1, p2) = query(metadata.where(value: "__th")).slice(-2).map(e => e.location().position())
      let dx = p2.at("x") - p1.at("x")
      let dy = p2.at("y") - p1.at("y")
      line(
        end: (dx, dy),
      )
    }
  }),
  [111\ 1],
  [22222], [3],
)
具体原理请参考 bluss 的论坛帖子。
手动指定斜线单元格的内容(diagbox)
未发布到 Typst Universe 的第三方包 diagbox 实现了这个功能。只需要下载代码到项目目录,然后引入其中的 tdiagbox 和 bdiagbox 即可使用。
例如:
typst
#import "diagbox.typ": *

#table(
  columns: (auto, auto, auto),
  align: horizon + center,
  bdiagbox[Names][Properties], [*Can Walk*], [*Can Run*],
  [*Character A*], [Yes], [No],
  [*Character B*], [No], [No],
)
注意 bdiagbox 中的内容必须足够大,以 "撑开" diagbox,不然斜线会偏离对角。如果内容实在不够长,可以适当填充 #h。